Optimise workunit performance using the HPCC Systems Workunit Analysis Tool
How can we make this long-running ECL job complete sooner? Are the assumptions that we make regarding the datasets correct? What is the ideal size of the cluster that for this job?
Post-execution analysis of workunits is an important process to follow to be able to answer these questions and gather the information necessary to optimize them.
Historically, ECL developers would have conducted all workunit analysis manually. A thorough manual analysis of a large workunit is both time-consuming and difficult. It is time-consuming because a large workunit consists of many hundreds of activities. It is difficult because manually interpreting the dozens of metrics and determining if they indicate anything suspicious is a complicated process.
Some metrics are self-explanatory and ECL developers will be able to make the correct interpretation with little difficulty. However, there are others that are difficult to interpret and may be truly understood only by the platform developers. Assessing whether those metrics are within acceptable boundaries may require an in depth understanding of the underlying implementation or hardware. There are even some metrics that are tweaked, corrected and adjusted over time. So, even if an ECL developer correctly guesses the meaning of a metric at one point in time, that assessment may no longer be accurate in the future.
Some might say that given these constraints, it is expecting too much to ask all ECL developers to make sense of all metrics!
The Workunit Analysis Tool, introduced in HPCC Systems 7.6.x, is designed to assist ECL Developers in analyzing workunits by automating the process for some common issues. Using this tool ECL developers can examine workunit graphs and graph metrics to identify factors that may be impacting performance and also to identify potential flaws in the ECL code.
What does it mean for ECL developers?
The Workunit Analysis Tool scrutinizes thousands of activities (each containing dozens of metrics), in seconds and highlights potential issues. The tool may also identify issues that the developer is not aware of or, is not actively looking for at that moment in time. The Workunit Analysis Tool aids developers in understanding workunits better and reduces the need for lengthy manual analysis.
Fast automated analysis allows every Thor job to be examined for potential issues. Routine automated analysis means that issues affecting performance are less likely to be overlooked and developers will be able to spot potential issues quickly. This is a significant improvement on what may be possible using the manual analysis process since, only a small sample of workunits with obvious problems can be closely examined manually for practical reasons including time constraints.
Routine analysis is important is because conditions are not static:
- Characteristics of input datasets may change over time.
- External factors such as external services may change over time.
Routine analysis allows developers to respond more quickly to changes as they happen.
Some issues in the workunit may be obscure or complex to decipher. Previously, the ECL developer may have:
- Spent substantial amounts of time trying to locate the problem.
- Referred these sorts of complicated problems to the HPCC Systems platform developer.
- Accepted the less-than-optimal performance.
The Workunit Analysis Tool will continue to be enhanced to diagnose many of these issues and ECL developers should be able to self-diagnose many very complex issues quickly without external assistance.
Development Roadmap
The features available in the HPCC Systems 7.6.x series are available for Thor only and include:
- The ability to diagnose many skew related issues.
- Reporting of a cost estimate for every issue reported
- The provision of a CLI version (using the analyze option of wutool) and ability to update analysis with the CLI version.
The planned improvements for the next few releases will focus on expanding the ruleset, improving the cost calculation, providing more configurability and conducting the analysis while the job is executing (live analysis). There are also plans to support Roxie eventually. Some of the rules being considered in the next release include:
- Skewed spills
- Unbalanced join
- Issues caused by sequential operation
- Slow joins
- Ratio of disk IO time to size read out of line
- Index read/keyed join and large number of reject rows
- Large amount of time in functions and soap calls
- Long time waiting for queues
- Ideal cluster size to process job
How does it work?
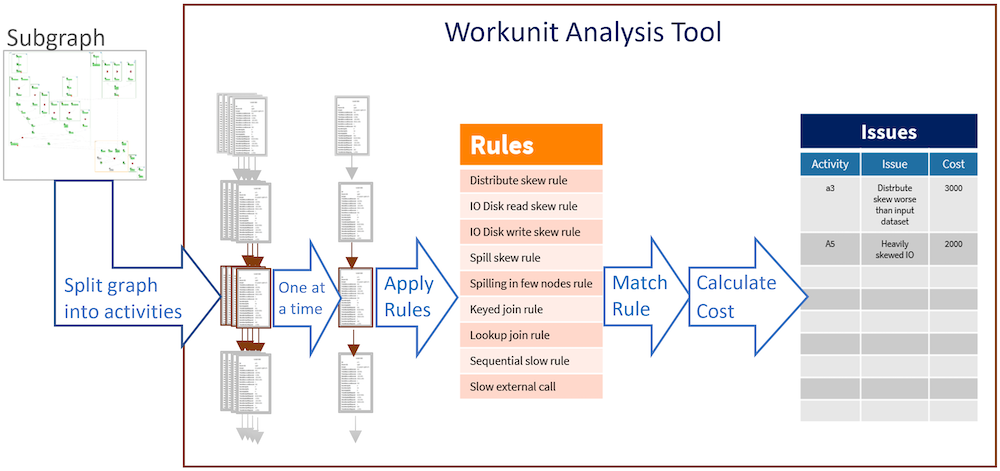
The Workunit Analysis Tool is a rules-based software tool that examines the metrics from each activity, looking for patterns that indicate a specific issue. The activities are examined one at a time, normally independently of one another, but may also be examined in conjunction with upstream and downstream activities.
The highest cost issue of every activity is reported.
Here is a diagram showing the architecture of the Workunit Analysis Tool:
Cost calculations
The Workunit Analysis Tool assigns a cost estimate to every issue reported. The cost is considered to be the time penalty to the graph’s execution time caused by the issue.
The cost estimate is calculated by working out the theoretical ideal execution time and subtracting it from the actual execution time for the activity.
Example – A heavily skewed graph
The theoretical minimum execution time for this type of graph would be identifiable by assuming that all the work was evenly spread across all the nodes (e.g. when skew = 0), which is the average execution time. This means the actual execution time would be the time taken by the slowest node. In the case of skews, the cost would be the difference between the node with the slowest execution time and the average execution time over all the nodes.
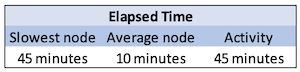
Using these example recorded metrics, we can see that the activity took 45 minutes. In this case, if it was possible to spread the load evenly among all the nodes, then it should be possible to reduce the activity’s execution time to 10 minutes.
The Workunit Analysis Tool in this case, would determine the cost to be 35 minutes.
The calculation is unlikely to be an accurate estimation of the actual cost of an issue. For some issues, the effect may be cancelled out by downstream activity. For others, the effect of the issue may be multiplied by its effect on downstream activities. And there are many issues for which no meaningful cost calculation is possible.
So really, the cost estimates reported are more of an indicator and the ECL developer will need to exercise judgement to assess whether the cost reported approximates to the actual cost of the issue.
Using the tool
The Workunit Analysis Tool executes automatically after every Thor job completes. No additional configuration is necessary, no buttons need to be pressed; it just does it. Any issues found are recorded in the workunit and are viewable from within the ECL Watch user interface. They are displayed in the workunit’s messages table, alongside any runtime error and warning messages, as shown highlighted in the screenshot below:
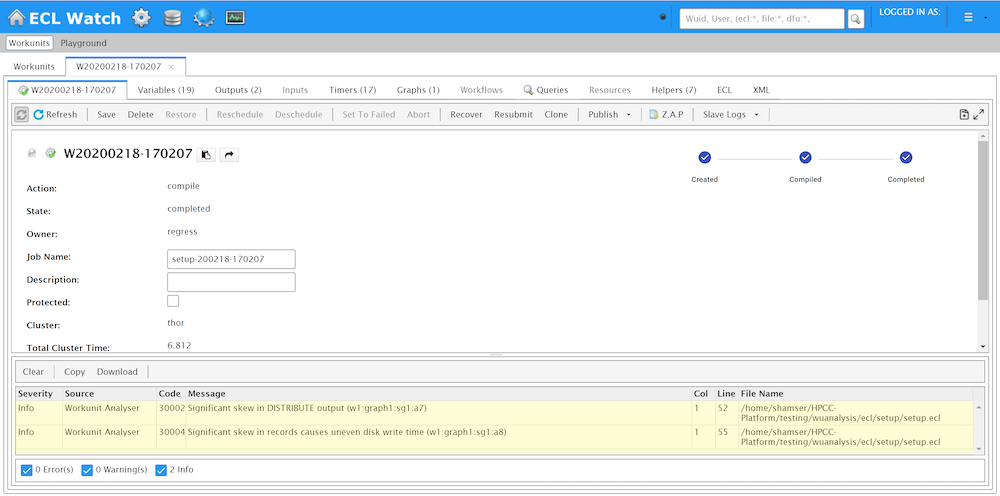
All Workunit Analysis Tool issues are identifiable from the Source column, showing the Workunit Analyzer value. All analyzer messages currently have the Severity column set to Info.
The Code column contains a unique identifier for the issue which may be useful when discussing the problem with other developers.
The Message column contains a human readable description of the issue. The id of the activity to which the issue relates, may be found at the end of the Message column (in parentheses).
The last 3 columns (Col, Line and Filename) provide the ECL file path and location within the file.
Command Line version
The Workunit Analysis Tool may also be executed manually. The command line version of the tool may be used to:
- Analyze historic jobs
- Re-analyze and update the existing analysis using a more recent version or to use it as part of some other processes.
Note: Access to Dali is restricted to specific whitelisted hosts/IP addresses. This means wutool will not be able to analyze workunits in environments using a foreign Dali, unless access has been whitelisted for the host from which wutool is executed.
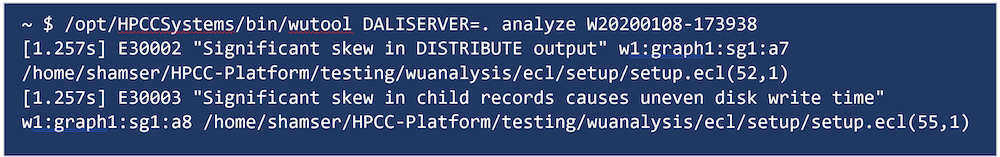
The command line version is accessed through the wutool as follows:
wutool DALISERVER=daliserver_ip analyze workunit(s) [UPDATEWU=1]
When the UPDATEWU parameter is set, the workunit will be updated with the new issues found.
The workunit will be analyzed and the highest cost issues will be displayed. Every issue will be shown on a separate line with the following information:
- Cost: The estimated time penalty of the issue to the execution time.
- Issue code: The unique code to identify the issue.
- Text description.
- Activity id.
- Source file and location of issue.
Here is an example of what will be displayed at the command line:
Summary
The Workunit Analysis Tool examines every Thor job automatically, every time it executes. It scrutinizes every metric from every activity to highlight potential issues. It is designed to diagnose and discover issues in ECL code or data, leaving ECL developers more time to contemplate and implement improvements.